Emissions visualization - List of Manufacturers, Suppliers, Companies and Products | IPROS

Emissions visualization Product List

1~3 item / All 3 items

Displayed results

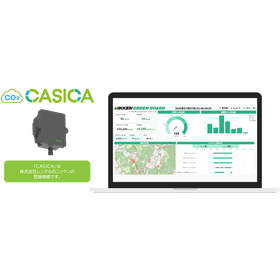
CO₂ Visualization Service "CASICA" for the Manufacturing Industry

Achieving both improved production efficiency and decarbonization!

In the manufacturing industry, efforts to maintain and improve production efficiency are required alongside initiatives to reduce environmental impact. In particular, understanding and reducing CO₂ emissions from equipment operation within factories is a critical issue for sustainable business operations. Accurate measurement of CO₂ emissions is essential for identifying areas for improvement and implementing effective measures, but manual aggregation and reporting tasks can become burdensome. Our service "CASICA" automatically calculates and visualizes CO₂ emissions from construction machinery operating data, addressing these challenges. 【Use Cases】 - Management of heavy machinery and vehicles within factories - Understanding CO₂ emissions from equipment operation on production lines - Visualization and improvement of energy consumption 【Benefits of Implementation】 - Reduced workload through automatic calculation of CO₂ emissions - Increased productivity through centralized management of operational status - Implementation of environmental measures based on data

  • Construction machinery leasing and rental
  • Emissions visualization

Added to bookmarks

Bookmarks list

Bookmark has been removed

Bookmarks list

You can't add any more bookmarks

By registering as a member, you can increase the number of bookmarks you can save and organize them with labels.

Free membership registration

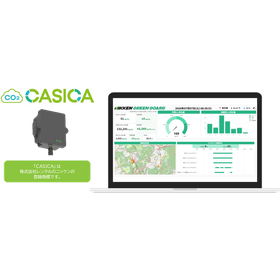
Infrastructure-oriented CO₂ visualization service "CASICA"

Improving inspection efficiency while visualizing CO₂ emissions.

In the infrastructure industry, there is a demand for both the efficiency of inspection work and efforts to reduce environmental impact. Particularly in the inspection of extensive infrastructure facilities, it is important to understand the movement of workers and the operational status of construction machinery to accurately grasp CO₂ emissions. However, traditional inspection tasks often require a lot of time and effort to aggregate and analyze this information, which can hinder efficiency. Our CO₂ visualization service "CASICA" addresses these challenges by automatically calculating and visualizing CO₂ emissions from the operational data of construction machinery. 【Usage Scenarios】 - Management of construction machinery operations during infrastructure inspections - Understanding CO₂ emissions along inspection routes - Improving the efficiency of on-site work 【Benefits of Implementation】 - Increased efficiency of inspection tasks - Accurate understanding of CO₂ emissions - Reduced burden of reporting tasks

  • Construction machinery leasing and rental
  • Emissions visualization

Added to bookmarks

Bookmarks list

Bookmark has been removed

Bookmarks list

You can't add any more bookmarks

By registering as a member, you can increase the number of bookmarks you can save and organize them with labels.

Free membership registration

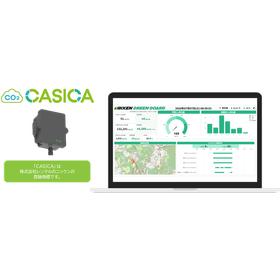
CO₂ Visualization Service 'CASICA' for Cleaning Operations

Automatically calculate CO₂ emissions from cleaning operations. Support efficiency and reduction of environmental impact.

In cleaning operations, it is necessary to understand and manage factors related to CO₂ emissions, such as the equipment used and the distance traveled. Particularly for achieving environmental goals and improving operational efficiency, it is important to accurately grasp these emissions and consider improvement measures. However, manual aggregation and reporting tasks are burdensome, and there is a challenge in obtaining real-time situational awareness. Our service "CASICA" supports the resolution of these issues by automatically calculating and visualizing CO₂ emissions from construction machinery operating data. 【Usage Scenarios】 - Management of the operating status of cleaning vehicles and equipment - Understanding CO₂ emissions by work area - Emission analysis based on travel distance and operating time 【Benefits of Implementation】 - Contribution to achieving environmental goals through the visualization of CO₂ emissions - Reduction of operational burden through the efficiency of aggregation and reporting tasks - Optimization of work through centralized management of operating status

  • Construction machinery leasing and rental
  • Emissions visualization

Added to bookmarks

Bookmarks list

Bookmark has been removed

Bookmarks list

You can't add any more bookmarks

By registering as a member, you can increase the number of bookmarks you can save and organize them with labels.

Free membership registration